Quantitative mass spectrometry data analysis#
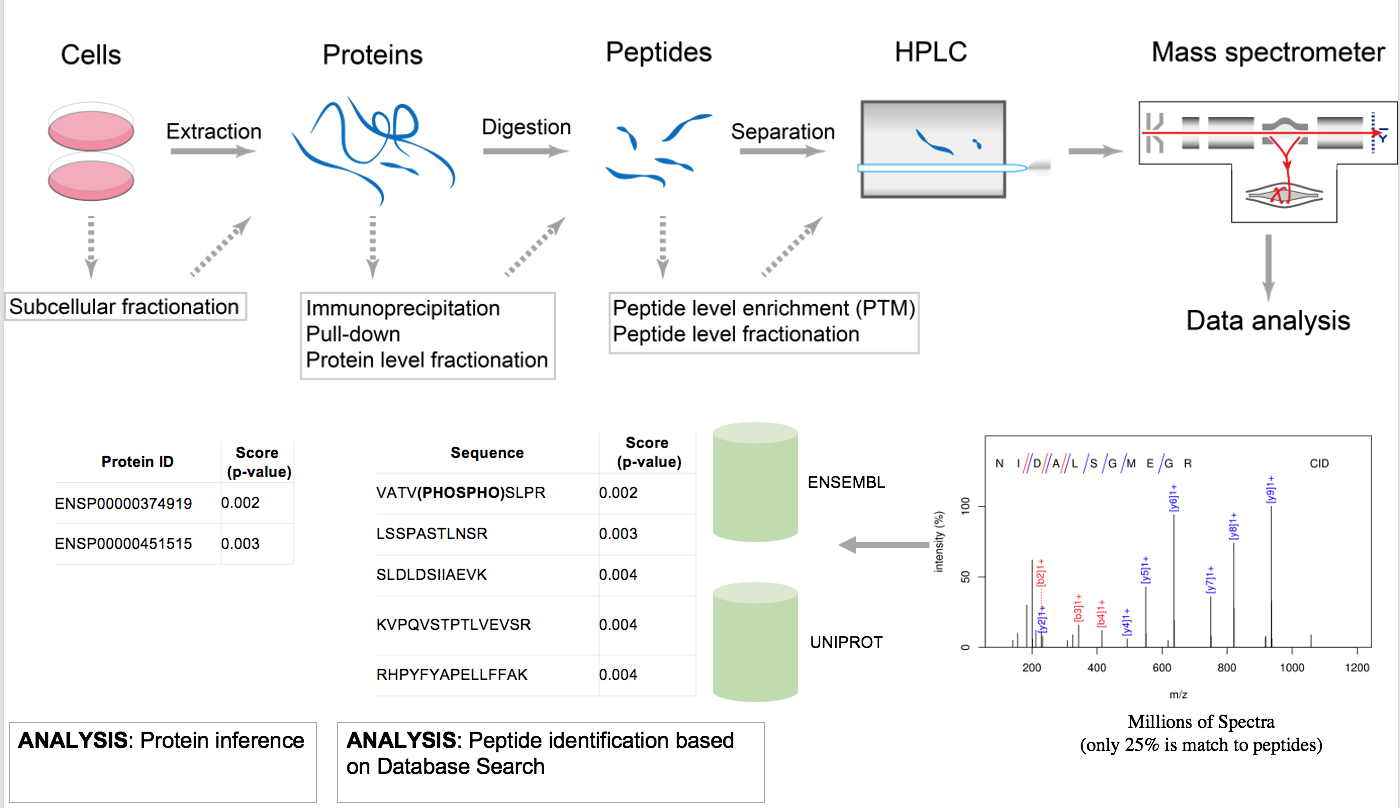
Bottom-up proteomics is a common method to identify proteins and characterize their amino acid sequences and post-translational modifications by proteolytic digestion of proteins prior to analysis by mass spectrometry. In bottom-up or shotgun proteomics [AEBERSOLD2003], the protein extract is enzymatically digested, followed by one or more dimensions of separation of the peptides by liquid chromatography coupled to mass spectrometry. By comparing the masses of the proteolytic peptides or their tandem mass spectra with those predicted from a sequence database, peptides can be identified and multiple peptide identifications assembled into a protein identification.
Different quantification strategies#
Quantification strategies in proteomics depend on the acquisition strategy used on the mass spectrometer and how/if the peptides were labelled with special reagents or isotopes. Acquisition strategies can be divided into the highly reproducible data-independent acquisition (DIA) strategies (e.g., SWATH) and the well-proven, sensitive data-dependent acquisition (DDA). With respect to usually more expensive labelling strategies, the most commonly employed ones are the isobaric chemical labels iTraq and TMT and the metabolic labelling strategies (usually based on isotopically labelled amino acids) like SILAC (TODO link) (SILAC is not yet supported by this pipeline). The advantage of labels is that they allow multiplexing of samples and avoiding retention alignment and the implied requirement of having a very reproducible chromatography.
Workflow-based analysis#
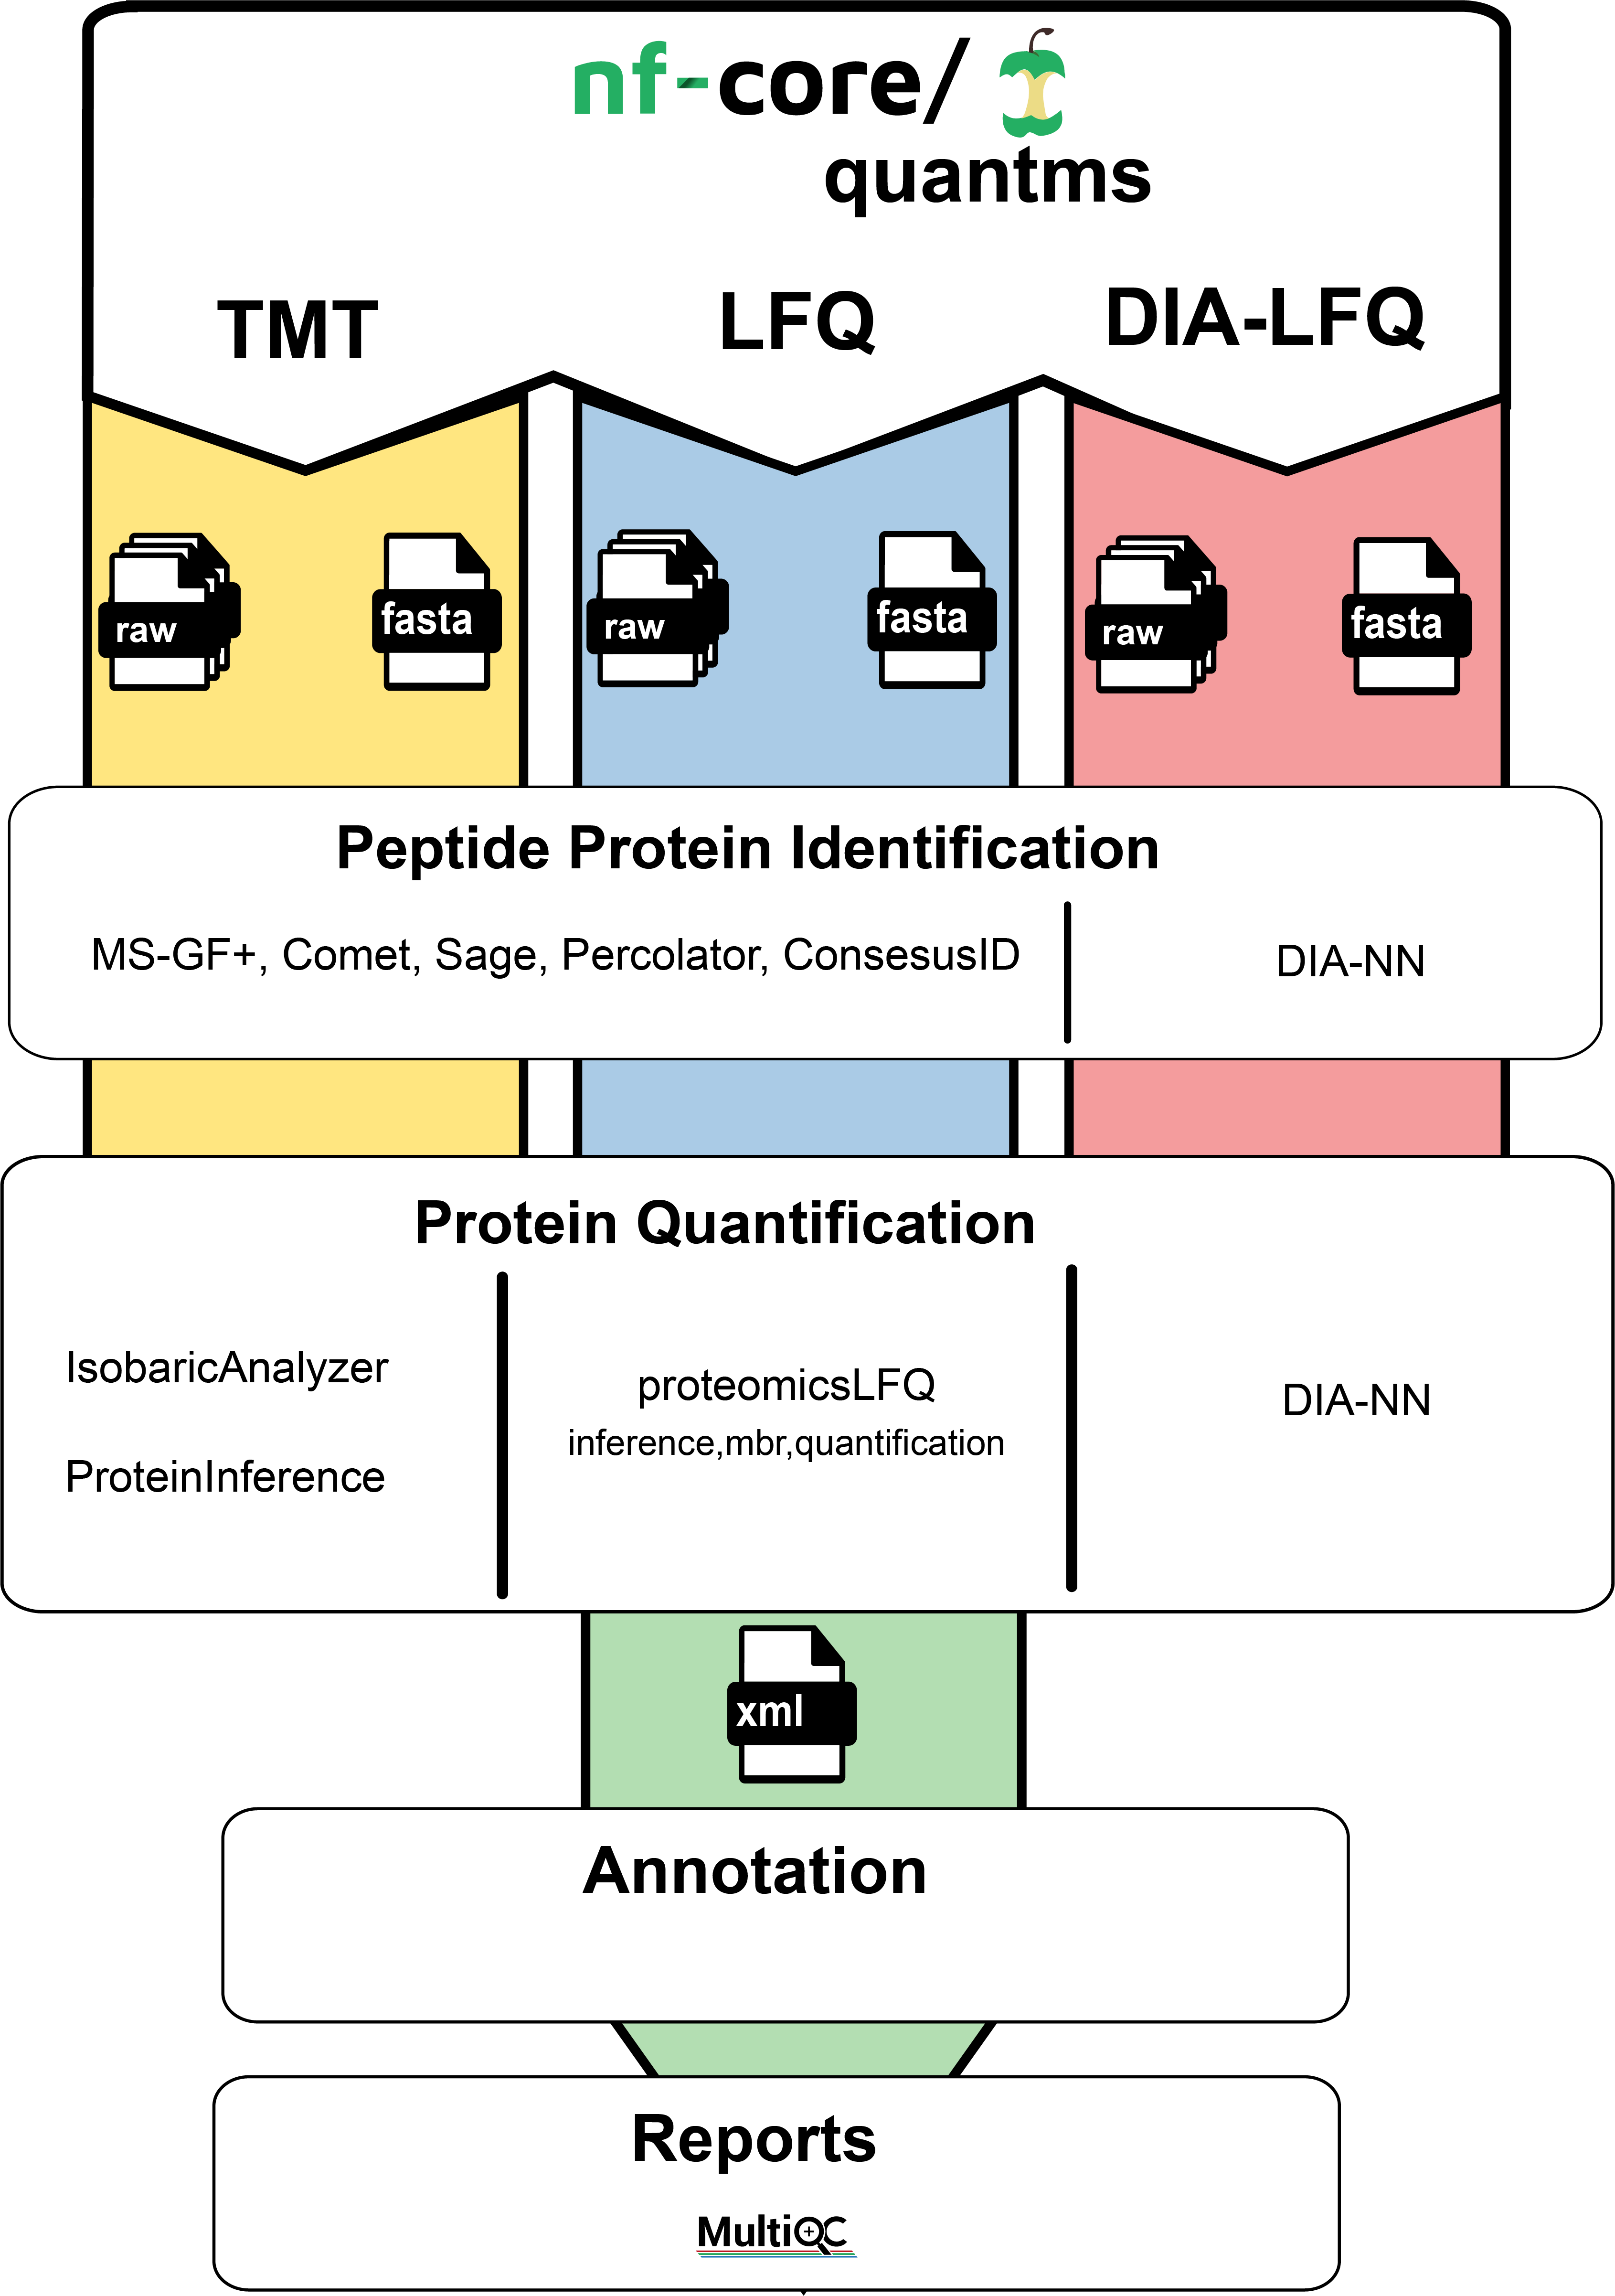
While there exist tools for the analysis of shotgun proteomics data like MaxQuant [Cox2008], most of these tools are designed as single-tiered/monolithic software application where tasks cannot be distributed or evaluated separately, therefore limiting the scalability and reproducibility of the data analysis [RIVEROL2020]. The different sub-workflows of the quantms workflow on the other hand enable the distribution of all the different steps of a peptide identification and quantification workflow in cloud or HPC environments through the usage of nextflow [DI2017]. It also features rich quality control reports and different methods for automated downstream statistical post-processing including reports on significance analysis for differential expression which all can be emailed to you after successful completion of the pipeline. The workflow can be configured solely by an SDRF input file for easy one-command-reanalyses of PRIDE datasets but also offers extensive configurability on either a web-based or a guided command-line interface provided through its integration into nf-core [EWELS2020]. The membership in nf-core additionally secures best practices of open and collaborative development of the pipeline including continuous testing after every contribution. The used software is strictly versioned through the exclusive usage of (bio-)conda packages whose association with the biocontainer ecosystem [DA2017] also allows us to provide a workflow profile for several containerization software’s (like docker, singularity, podman, etc.). Containerization ensures an even more reproducible environment for your analyses. The pipeline can easily be supervised on-the-fly via nf-tower. Failed runs can be debugged by investigating the rich pipeline execution reports.
quantms workflow in a nutshell#
Mass spectrometry quantitative data analysis can be divided in the following main steps. Make sure to follow the links to get to know more about the implementation details of specific steps in the pipeline.
Peptide identification
Through matching of peptide fragment spectra (Peptide identification from fragment spectra)
with protein database and known modifications
with protein database and unknown modifications
with spectrum database
without database (de novo)
Peptide quantification
DDA
- label-free
Through finding interesting features (or 3D peaks) on MS1 level, consisting of isotopic traces with the same elution profile (either targeted at locations with identifications or untargeted), aligning and matching them between runs, potentially re-quantifiying missing features and lastly integrating the intensity of the raw peaks in those features (Label-free quantification with DDA (LFQ)).
- label-free
- isobaric labels
Through comparing the intensity of reporter ions arising from the fragmentation of the isobaric label in the fragment spectra either in the MS2 spectrum used for identification or in separate MS3 spectra (Isobaric quantification with DDA).
- isobaric labels
- metabolic labels
Through feature finding (as in label-free) and linking features with a mass shift depending on the isotopes in the label. Matching modifications in the fragment spectra if available can be used to confirm links.
- metabolic labels
DIA
(transition) library-free
Through creating a library of transitions to extract and compare based on the results from peptide search engines, aligning the extracted peak groups, and performing rigorous statistical testing of those peak group to classify them correctly
With diaNN (Data-independent acquisition (DIA) quantification)
- (transition) library-based
with predefined transition libraries
- Protein inference and quantification
This is done to map ambiguous peptides to the mostly likely proteins of origin and to create protein groups based on the ambiguity level between them. Heuristics based on inference scores and groupings can then help in deciding which peptides to use for quantification of which protein. Aggregation of quantities to the protein level can be performed by several different rules (e.g., top-3) or left to the downstream statistical tools (Protein inference).
- Downstream (statistical) data analysis
Downstream data analysis tools like MSstats and Triqler can perform more elaborate normalization, imputation, aggregation and statistical significance testing based on the raw intensities, protein associations and scores from the upstream pipeline (Statistical post-processing of raw quantification results).
- Quality control
Our chosen and developed quality control tools gather required information from the resulting mzTab file and optionally intermediate results to provide statistics and summary plots of important quality control metrics like (pMultiQC).
References#
Aebersold, R., Mann, M. Mass spectrometry-based proteomics. Nature 422, 198–207 (2003). https://doi.org/10.1038/nature01511.
Cox J, Mann M. MaxQuant enables high peptide identification rates, individualized p.p.b.-range mass accuracies and proteome-wide protein quantification. Nat Biotechnol. 2008;26(12):1367-1372. doi:10.1038/nbt.1511.
Perez-Riverol Y, Moreno P. Scalable Data Analysis in Proteomics and Metabolomics Using BioContainers and Workflows Engines. Proteomics. 2020 May;20(9):e1900147. doi: 10.1002/pmic.201900147. Epub 2019 Dec 18. PMID: 31657527.
Di Tommaso, Paolo et al. Nextflow enables reproducible computational workflows. Nature biotechnology vol. 35,4 (2017): 316-319. doi:10.1038/nbt.3820.
Ewels, Philip A et al. The nf-core framework for community-curated bioinformatics pipelines. Nature biotechnology vol. 38,3 (2020): 276-278. doi:10.1038/s41587-020-0439-x.
da Veiga Leprevost, Felipe et al. BioContainers: an open-source and community-driven framework for software standardization. Bioinformatics (Oxford, England) vol. 33,16 (2017): 2580-2582. doi:10.1093/bioinformatics/btx192.